
How the Value of Light Changes Your Photography
Learn about the sixth Element of Design- Value. I’ll cover what value is, how to measure it using the Zone System, and how it relates to color.
Prefer to watch this tutorial in video format? 😏
Today I'm going to run you through the sixth element of design, which is value. We’re gonna start by going over what value is, the primary trick to measuring it, and how it directly relates to color.
Let’s dive in!
What is Value?
Value is another word for the luminosity or brightness of an image. Essentially, it's anything in the spectrum from pure black all the way to pure white.
In the Dynamic Range tutorial, we covered a few different ways you can measure value, including zebra stripes and the histogram. We also talked in the Exposure tutorial how to use shutter speed, aperture, and ISO to control the amount of value in your shot.
Value can completely change the way an image looks, so it’s important to understand how it works.

This photo is a great example of how value (brightness) can add interest to a scene. Notice how the cactuses seem to be glowing from the highlights. This shot was taken at the Cholla Cactus Garden in Southern California.
Why is Value Important?
Value Adds Depth
One of the reasons value is important is because it adds depth to your image.
As we discussed in the Form tutorial, using the full tonal range of light can really help make your shots look more 3D. And if you're picking up on the trend here, one of the biggest goals in photography is to make your images feel three-dimensional. You want that realism factor to come through, and using value is a great way to achieve that.
For example, check out this shot right here:

This image, demonstrating how value adds depth to a photo, was taken at the Chatfield Gardens in Colorado.
You can see the leaves have a ton of tonal range, from very bright leaves at the front of the image, to the darker shadows below. Everything from dark to light is present, making the image feel like you could almost reach in and grab those leaves.
Value Creates Contrast
The second reason value is important is because it adds contrast to images. When you have both light and dark points, it divides the image into different sections. This lets the viewer understand which parts are illuminated and which are hidden from view.
Check out this shot right here:

This image, demonstrating how value affects the value of an image, was taken at Punta Jesus Maria in Nicaragua.
You can see I almost have it lined up to look like a yin-yang symbol, where one part of the image is lighter than the other. I also placed the leaf there, which adds more luminance value and creates a subject that pops.
In this case, value first draws our eye to the yellow leaf, and then to the division of the image down the middle and the bubble on the other side.
Value Establishes a Visual Hierarchy
The third reason value is important is that it helps build a visual hierarchy in the image. By illuminating certain parts, you're guiding the viewer’s eye, and telling them directly where to look. It’s your art- why wouldn’t you help them interpret it?
For example, check out this image of a staircase lit in a curving motion that descends into the woods:

This photo, representing how value can establish visual hierarchy in an image, was taken at Zona Arqueológica Palenque in Mexico.
I made sure the staircase was well-illuminated because that’s where I want your eye to go. It’s the start of a visual journey deeper into the woods. The surrounding elements are intentionally shadowed because you don’t need to look there, the trees are all the same. I want the viewer to stay focused on the middle of the frame.
So as you can see, value can control multiple narratives within a shot.
The Psychology of Value
Let’s quickly go over the psychological associations of value.
Bright images typically feel fluffier, airier, happier, and more positive. On the other hand, images with lots of dark shadows feel more moody, intense, or heavy on the eye.
For example, here's a shot of aspen trees:
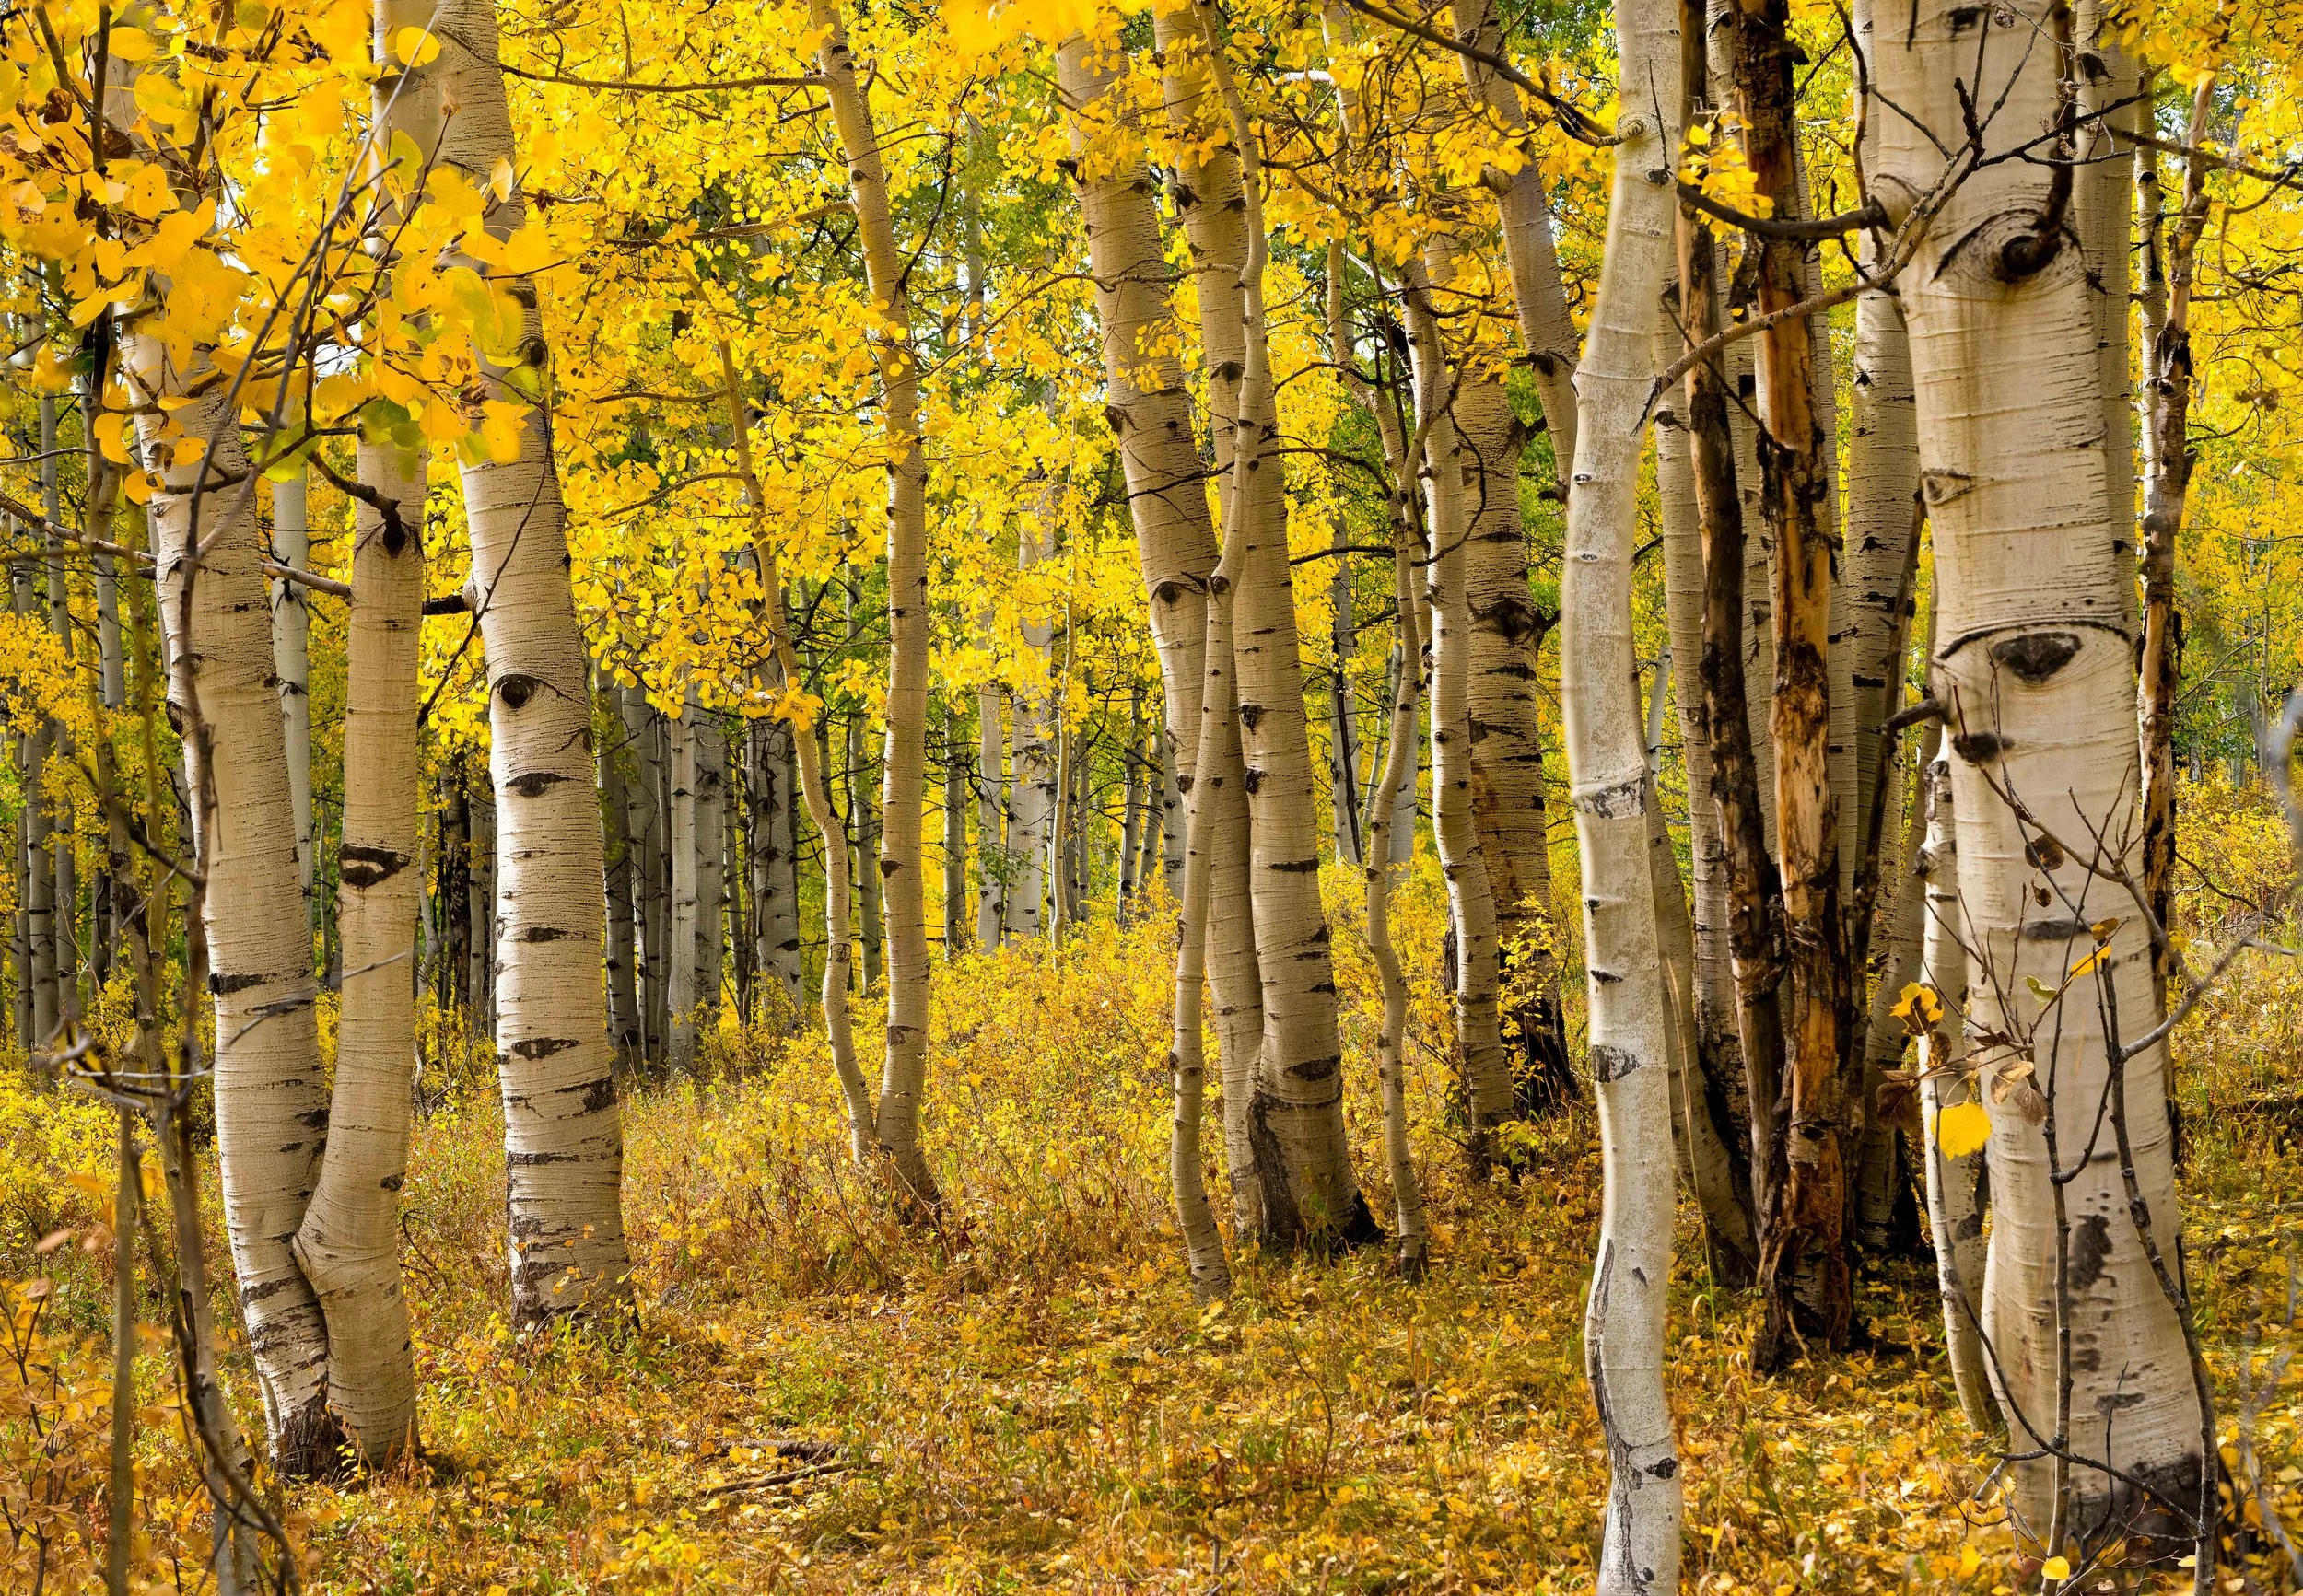
This photo, showing how bright highlights can convey a happy mood, was taken at Keebler Pass in Colorado.
The shot has bright yellow tones and an open lighting. This makes it feel happy, vibrant, and like an interesting place to hang out. Now contrast that with this next shot:

This photo, which represents how shadows can convey darker moods in an image, was taken at Cenote Ik Kil in Mexico.
The leaves are isolated in the darkness, overhanging an edge that drops into the unknown. The shot is small, shadowy, and evokes a heavy, lonely feeling.
These contrasting images are a great way to demonstrate how you can use luminance value to create emotion and tone in your photography.
The Zone System
Now let’s talk about the Zone System, another way of measuring luminance value that I haven’t covered yet. If you remember from earlier, the other two ways to measure luminance in-camera are through zebra stripes and the histogram.
However, the Zone System is a bit more intricate, which is why I saved it for this chapter specifically. The system was invented by Ansel Adams, who is widely considered one of the grandfathers of landscape photography. He’s essentially the guy who made it famous. If you’re into photography history, I definitely recommend checking him out.
The Zone System categorizes light on a scale from 0 to 100, where 0 equals pure white and 100 equals pure black. But when used practically, it’s broken down into 11 zones, from Zone 0 (pure black) to Zone 10 (pure white). Every zone is separated by one stop of light.
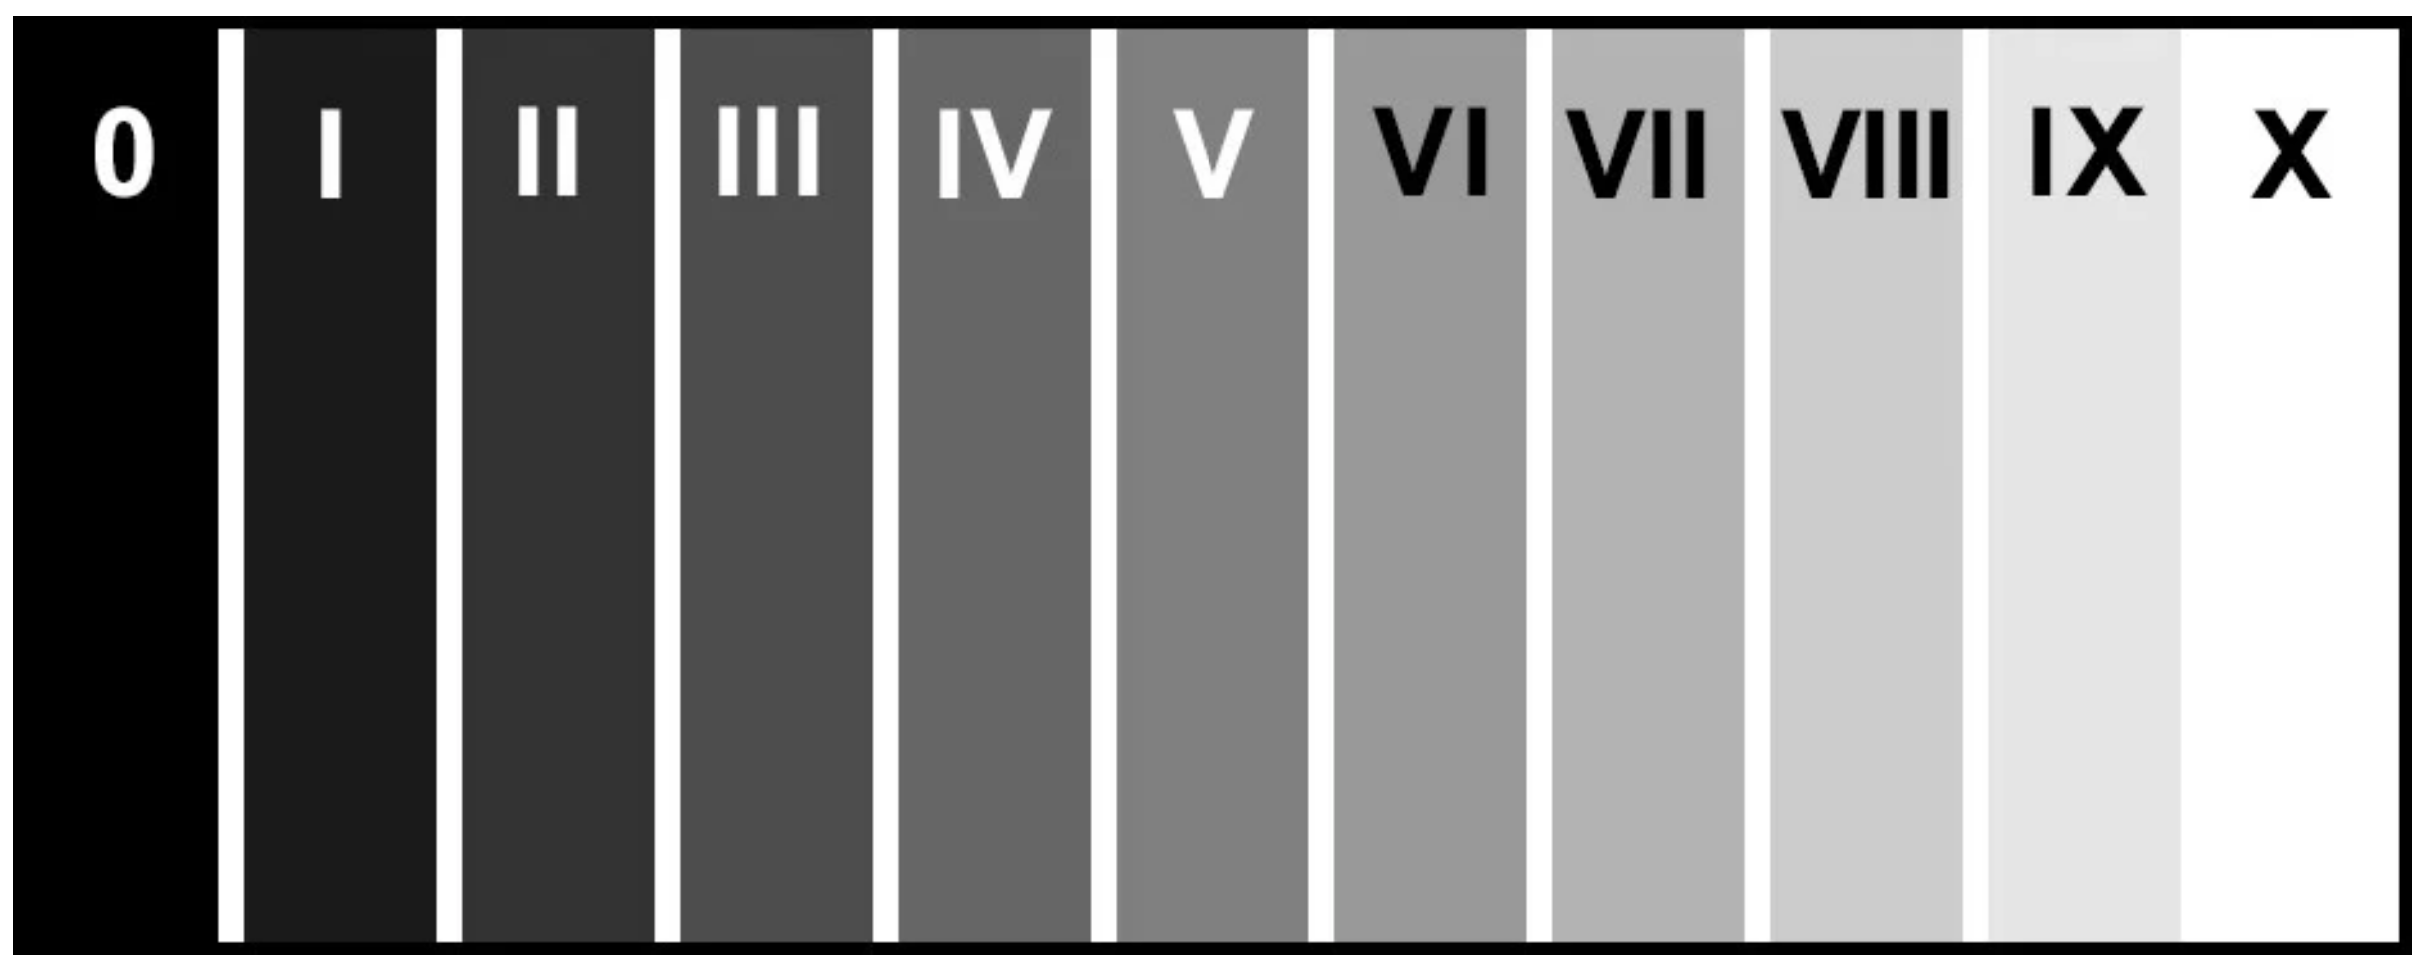
The Zone System
If you look at your image and pick a specific area, you can sort the luminance value of those pixels into one of these 11 Zones. You can even do this in Photoshop. Just open the Info Panel (under the "Window" tab), hover over a pixel, and check its percentage. Then you can assign it to a Zone.
So, for example, to move from Zone 3 to Zone 4, you’d adjust your exposure using aperture, shutter speed, and/or ISO by one full stop of light.
Now, you may be wondering why you would go through the trouble of understanding this. Well, the general theory behind this system is that in every image you want to include a full range of zones, including darks, lights, and mid-tones. This creates a well-balanced image that’s pleasing to the eye, and feels realistic.
If you only have too many highlights, your image may be blown out. If you have too many shadows, it could be too dark. And if you have too many mid-tones, it might look flat and lack dimensionality.
Now of course, there are artistic reasons to break this rule, but as a beginner, it’s a helpful guideline for learning how to expose most of your images. We got to understand the rules before we break them!

This photo of a shoreline was taken at the Sutro Baths in San Francisco, California, has a solid transition of highlights to shadows.
Value’s Relationship to Color
One thing to realize about value is that it is directly correlated with color. If you change the value of a pixel, it actually changes the color of it as well. That is because value is one of the three components of color. (The other two, as we covered in the Color tutorial, are hue and saturation!)
Value is essentially how much white or black is mixed into a color. There are a few ways to measure this:
The Color Wheel
The first way to measure value in a color is to use a color wheel. As you move toward the center, colors get lighter (more white = higher value.) On the other hand, as you move toward the edges, colors get darker (more black = lower value.)
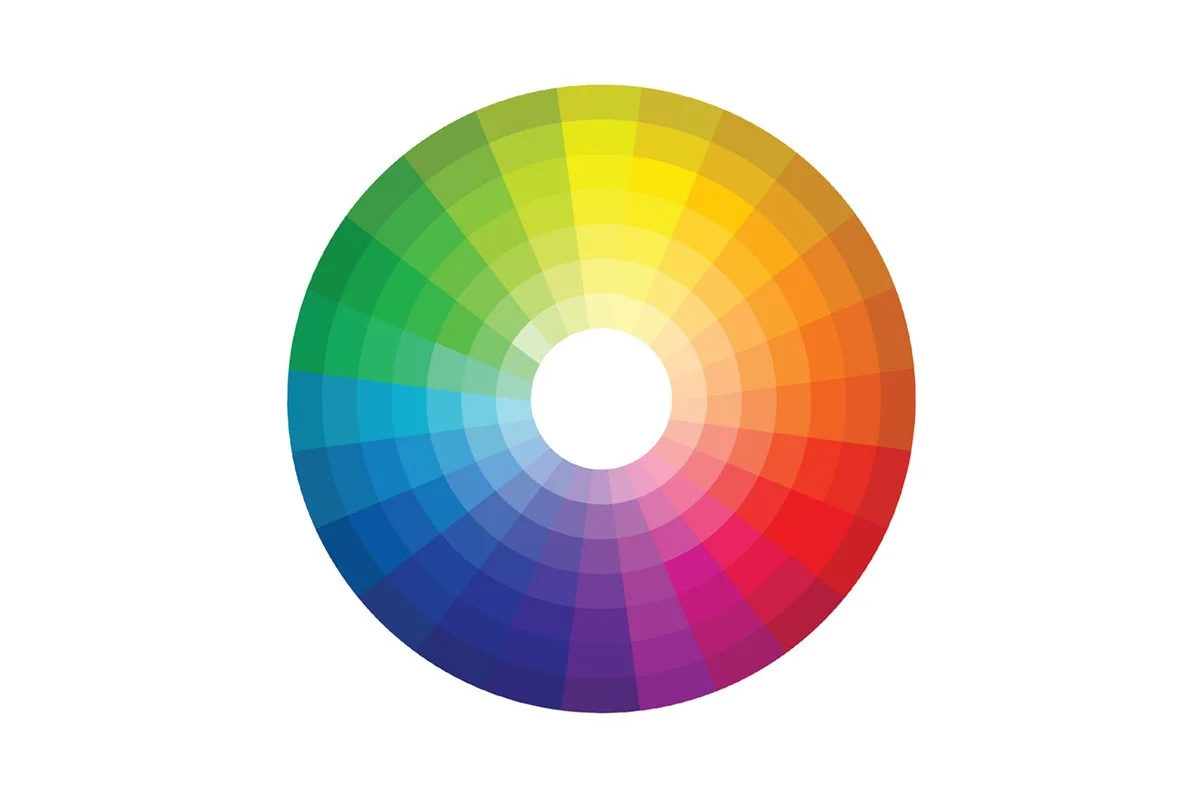
The Color Wheel
The Histogram
The second way to measure value in a color is the histogram. If you don’t remember how it works, here’s a quick refresher on it:
The left side of the histogram shows how many dark pixels (shadows) are in your image. The right side shows how many light pixels (highlights) there are.
Now you’ll also notice colors on the histogram, which represent the RGB color channels: Red, Green, and Blue, as well as their complementary opposites: Cyan, Magenta, and Yellow. We didn’t talk about colors when we first introduced the histogram in the Dynamic Range tutorial, because I was saving it for now.
Let’s take a look at this shot of a dock in Guatemala and its relevant histogram, for example:

This photo, used to demonstrate how the histogram works with value and color, was taken at Lake Atitlán in Guatemala.

The Histogram
The most obvious part of the histogram is the blue spike in the middle, representing mid-tone blues in the image. On the right, we have red, which are from the bright red hues in the sun. On the left, there are yellows showing up from the shadowy parts of the clouds.
You can also see other color spikes here and there, but they are fairly minimal in this image. This shot gives you a distinct way to see how color and value intersect in your shots.
Conclusion
In conclusion, value is an under-rated topic in composition conversations. By understanding how value can control your image, you can easily add depth, contrast, and a visual hierarchy within your image.
The most important thing when starting out is ensuring your images contain the full spectrum of light in them- highlights, mid-tones, and shadows. This can be effectively measured by using the Zone System, the color wheel, and the histogram. Once value balance is mastered, you can learn to play with the values to create something truly unique.
Let’s jump to the next tutorial, where I’m going to talk about final Element of Design- Space!